
How to Calculate Feed Cost Losses Due to High FCR in Broilers—a Factor Often Overlooked
Many broiler farmers are familiar with the term FCR, know how to calculate it, and understand that a lower number is better. However, when asked exactly how many rupiah are actually lost due to an FCR higher than the target, most will give a rough estimate or may not have even calculated it explicitly. In fact, converting the FCR into a concrete rupiah figure is a crucial step that can change how farmers view the urgency of improving feed efficiency.
Without clear calculations, an FCR that is slightly higher than the target is often considered “normal variation” that isn’t particularly concerning. But when that difference is converted into rupiah and multiplied by the annual production scale, the figure is often much larger than imagined—and this is what should serve as a wake-up call for farmers to truly prioritize FCR improvement as part of their business strategy, rather than just a technical note at the end of the cycle.
This article discusses how to concretely calculate feed cost losses resulting from suboptimal FCR, provides a calculation framework that farmers can immediately apply to their own farm conditions, and explains how IoT-based monitoring helps prevent these losses at the source.
Why Feed Is the Most Critical Cost Variable to Understand
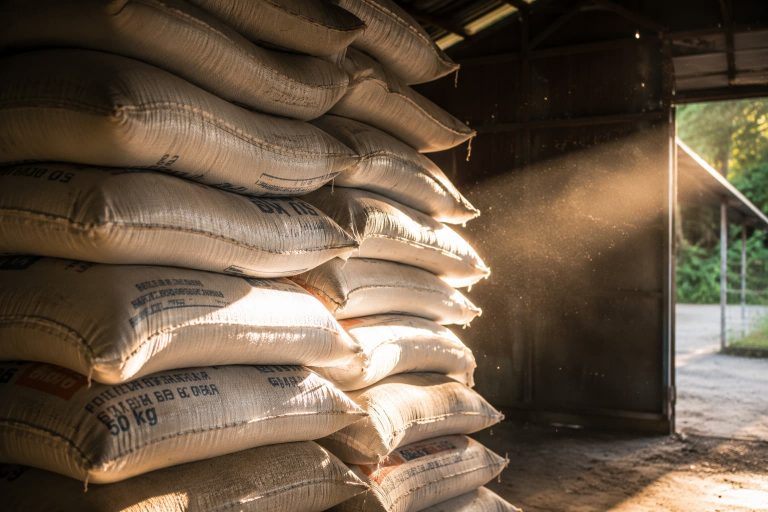
Before discussing loss calculations, it is important to understand why feed is the primary focus in broiler production cost analysis. Based on research from the UIN Sultan Syarif Kasim Riau Journal of Animal Husbandry, the composition of broiler production costs in a partnership system shows that feed accounts for about 77.64% of total costs, far exceeding the cost of day-old chicks (DOC), which is 20.66%, and chemical vitamins and medications (OVK), which is 2.93%. In general, other studies also confirm that feed accounts for about 70 to 77% of total production costs.
Given this proportion, it is clear that any improvement in feed efficiency will have a far more significant impact on profit margins than efficiency efforts targeting other cost components, such as day-old chicks (DOC) or medications. This is why FCR is such a central metric in evaluating farm performance—it directly reflects efficiency in the cost component with the largest share.
Basic Framework for Calculating Losses from FCR Deviations
To calculate losses resulting from an FCR higher than the target, farmers need to compare two scenarios: the actual FCR achieved and the target or ideal FCR that should have been achieved with more optimal management. The difference between these two FCRs, multiplied by the total harvest weight and the feed price per kilogram, will yield an estimate of the loss in rupiah.
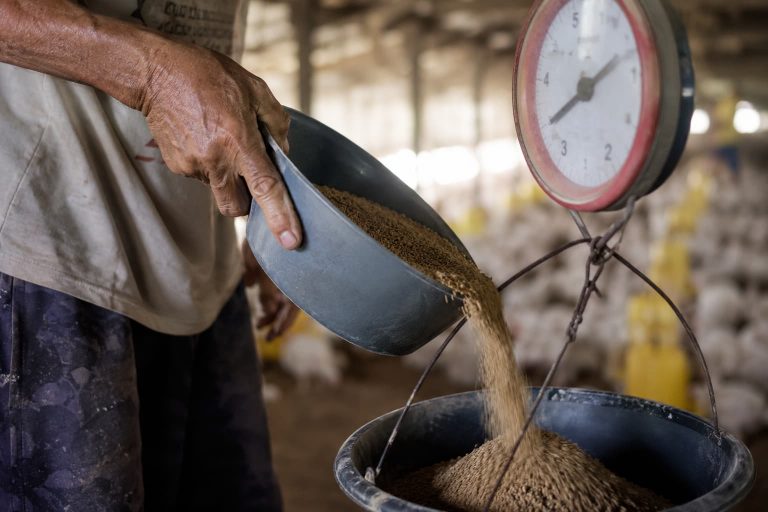
As a simple illustration, suppose a flock of 4,000 birds produces a total harvest weight of 6,000 kg (an average of 1.5 kg per bird). If the actual FCR achieved is 1.7, then the total feed consumed is 1.7 multiplied by 6,000, which equals 10,200 kg. However, if the target FCR that should be achievable with optimal management is 1.5, then the total feed that should be required is only 1.5 times 6,000, or 9,000 kg.
The difference is 10,200 minus 9,000, which is 1,200 kg of feed wasted due to a suboptimal FCR. If the price of feed per kilogram falls within a certain range based on current market conditions, the loss from a single cycle in one pen can be calculated by multiplying 1,200 kg by that feed price. On a larger scale—for example, a farmer operating multiple pens year-round with several production cycles—this loss figure will increase significantly.
Why a Seemingly Small FCR Difference Can Have a Major Impact on an Annual Basis
A common misconception is to view an FCR difference of 0.1 or 0.2 points as “small” and not important enough to prioritize. This perception typically arises because farmers only consider the impact on a single production cycle, without accounting for the cumulative effect on an annual and multi-house scale.
For example, given that Indonesia’s poultry industry recorded a national broiler meat production of 3.84 million metric tons in 2024, even a 0.1-point improvement in FCR efficiency across the entire industry collectively represents a massive savings in national feed costs, considering the massive scale of feed consumption required to achieve that production volume. The same logic applies at the individual farmer level—the larger a farmer’s production scale, whether in terms of the number of barns or the number of production cycles run throughout the year, the greater the cumulative impact of every small improvement in FCR.
Farmers who run four to five production cycles per year in a single barn—and who own more than one barn—will experience a far greater cumulative impact from FCR improvements than farmers who run only one or two cycles in a single small barn. This is why farmers with larger-scale operations have a stronger financial incentive to invest in monitoring systems that help consistently maintain the FCR at an optimal level.
Sources of FCR Losses That Are Often Not Explicitly Recognized
Based on previous discussions regarding factors that influence FCR, there are several specific sources of loss that are often not explicitly accounted for by farmers but contribute significantly to suboptimal FCR.
Losses resulting from heat stress that is not detected in a timely manner are among the most significant, given their impact on reduced feed intake and simultaneous growth retardation. Every day that chickens experience heat stress without proper management means that day contributes to a worse FCR than if the house temperature were consistently maintained at an optimal level.
Losses due to high ammonia levels, which affect appetite and respiratory health, also contribute significantly—especially in houses with suboptimal ventilation. Losses resulting from delayed disease detection—which allows the disease to spread to more chickens before treatment is administered—are another significant source of FCR losses but are often not explicitly separated from the “overall cycle FCR” reported at the end.
Understanding these specific sources is important because it helps farmers identify which areas contribute most to FCR losses in their flocks, so that investments in improvements can be directed toward the areas with the greatest impact, rather than generic, scattered efforts without a clear focus.
How IoT Monitoring Helps Prevent Losses at the Source
IoT-based monitoring helps prevent FCR losses not by directly changing the FCR figure, but by addressing the root causes more quickly and precisely than manual approaches. Every hour of delay in detecting and responding to abnormal temperatures, high ammonia levels, or early signs of disease means an additional period during which the chickens are exposed to harmful conditions, which ultimately accumulates into a worse FCR at the end of the cycle.
With an automated alert system, the duration of the chickens’ exposure to adverse conditions can be significantly reduced compared to relying on manual checks conducted only a few times a day. This reduction in exposure duration directly correlates with a better FCR, as the chickens spend more time in optimal conditions for growth rather than in stressful conditions that divert feed energy toward survival.
In addition, historical data collected from the monitoring system allows farmers to conduct a more precise root-cause analysis of the factors behind high FCR in previous cycles, so that management improvements in subsequent cycles can be more targeted and effective, compared to a trial-and-error approach that takes longer to identify the actual causes.
Developing Loss Calculations as a Tool for Justifying Investments
One practical benefit of this FCR loss calculation framework is its usefulness as a tool for justifying investment in monitoring systems. When farmers can concretely demonstrate how many rupiah are lost per cycle due to suboptimal FCR, the decision to invest in a monitoring system becomes easier to justify than if based solely on qualitative arguments regarding “efficiency” or “modern technology.”
Farmers who wish to perform this calculation for their own operations can start by collecting FCR data from the last few cycles, comparing it to the ideal FCR target based on the strain and harvest age used, and then converting the difference into rupiah based on current feed prices. This simple calculation, while not requiring complex financial expertise, often serves as a turning point that changes farmers’ perceptions regarding the urgency of improving data-driven management.
Case Study: Loss Calculations That Changed a Farmer’s Investment Decision
A farmer with two farms in West Java, each with a capacity of 5,000 head, recorded an average FCR of 1.75 the previous year, while the ideal target—which should have been achievable with optimal management based on the strain used—was 1.55. This 0.2-point difference was initially considered “reasonable” by the farmer, until he tried to calculate its concrete impact in rupiah.
Assuming a total harvest weight of 7,500 kg per barn per cycle (an average of 1.5 kg per bird), a 0.2-point difference in FCR translates to approximately 1,500 kg of additional feed consumption per barn per cycle. With two pens and four production cycles per year, the total amount of feed wasted reaches 12,000 kg per year. At the prevailing feed prices at the time, this figure equaled tens of millions of rupiah in losses each year—a figure far greater than the farmer’s initial estimate and far exceeding the investment cost of the IoT monitoring system under consideration.
After reviewing these calculations, the farmer decided to invest in a system to monitor temperature, humidity, and ammonia levels in both of his barns. The following year, with the FCR improving to an average of 1.58 thanks to faster detection of and response to abnormal barn conditions, the farmer managed to recoup most of the previously identified losses, with the savings far exceeding the investment cost of the monitoring system. The lesson from this case underscores that concrete loss calculations can be a far stronger driver of investment decisions than qualitative arguments alone.
FAQ: Questions About Feed Cost Losses Due to High FCR

How do I determine the ideal FCR target for my farm? The ideal FCR target can be determined based on the breed standard used (such as Ross or Cobb) and the planned harvest age, which is generally available from breeding stock suppliers or feed companies. Additionally, farmers can use the best performance ever achieved in previous cycles as a reference for a realistic target tailored to their specific farm conditions.

Do FCR losses only impact feed costs? Not only that. A high FCR is also often correlated with higher mortality and uneven growth, both of which contribute to financial losses beyond simply wasted feed costs. Furthermore, consistently poor FCR performance can also affect a farmer’s negotiating position within a partnership system with a parent company.

Is a 0.1-point difference in FCR truly financially significant? It is highly significant when calculated over a larger production scale and a longer timeframe. On a national industrial scale, even such a small difference translates to substantial collective feed savings. On an individual farmer’s scale—with several barns and multiple production cycles per year—the impact remains significant, though not as substantial as at the industrial level.

How long does it take to see a reduction in losses after improving FCR management? In many cases, improvements begin to appear as early as the first cycle after management changes are implemented, especially if the primary cause of high FCR is an issue that can be addressed immediately, such as undetected temperature fluctuations. However, consistent and stable improvements usually require several cycles to be fully validated as a trend, rather than merely random variations between cycles.

Do FCR loss calculations need to be performed by an accountant, or can farmers do them themselves? Basic calculations, such as those described in this article, can be performed by the farmer without requiring specialized accounting expertise, as they only require actual FCR data, the ideal FCR target, total harvest weight, and current feed prices. More complex calculations, such as ROI analysis for long-term investments, may require additional assistance if the farmer desires a more in-depth analysis.

Conclusion: Shifting the Perception from “Normal Variation” to Concrete Numbers
The financial losses from feed costs due to high FCR are often not fully realized by farmers because they have never been explicitly calculated in concrete rupiah amounts. Once this calculation is performed, the perception of the urgency to improve FCR usually changes significantly—from merely a “normal variation that isn’t very important” to a “real loss that needs to be addressed immediately.”
Understanding the magnitude of this loss is a crucial first step before farmers decide to invest in a monitoring system that can help consistently maintain FCR at an optimal level. BAKU provides an IoT monitoring system that helps farmers detect and respond to conditions contributing to a high FCR before their impact fully accumulates into significant losses by the end of the cycle. If you’d like to calculate the potential FCR losses in your own farm and discuss suitable solutions, the BAKU team is ready to help provide a more concrete picture based on your operational conditions.
References
  1. Journal of Animal Husbandry, UIN Sultan Syarif Kasim Riau. (2024). Evaluation of Broiler Chicken Farming under the Core-Satellite Partnership System Based on the Performance Index (IP). ejournal.uin-suska.ac.id
  2. Directorate General of Livestock and Animal Health, Ministry of Agriculture. (2024). Ministry of Agriculture Encourages Businesses to Expand Exports of National Poultry Products. ditjenpkh.pertanian.go.id
  3. Agrosilvopasture-Tech Journal, Vol. 3, No. 1. (2024). Body Weight Gain and FCR of the CP-707 Broiler Strain in the PT. Mitra Sinar Jaya Partnership. ojs3.unpatti.ac.id
  4. Chickin.id. (2024). Standards and Methods for Calculating FCR in Broiler Chickens. chickin.id/blog
  5. De Heus Indonesia. (2024). How to Determine FCR for Broiler and Layer Chickens: A Comprehensive Guide. deheus.id
Scroll to top
× Whatssapp Us